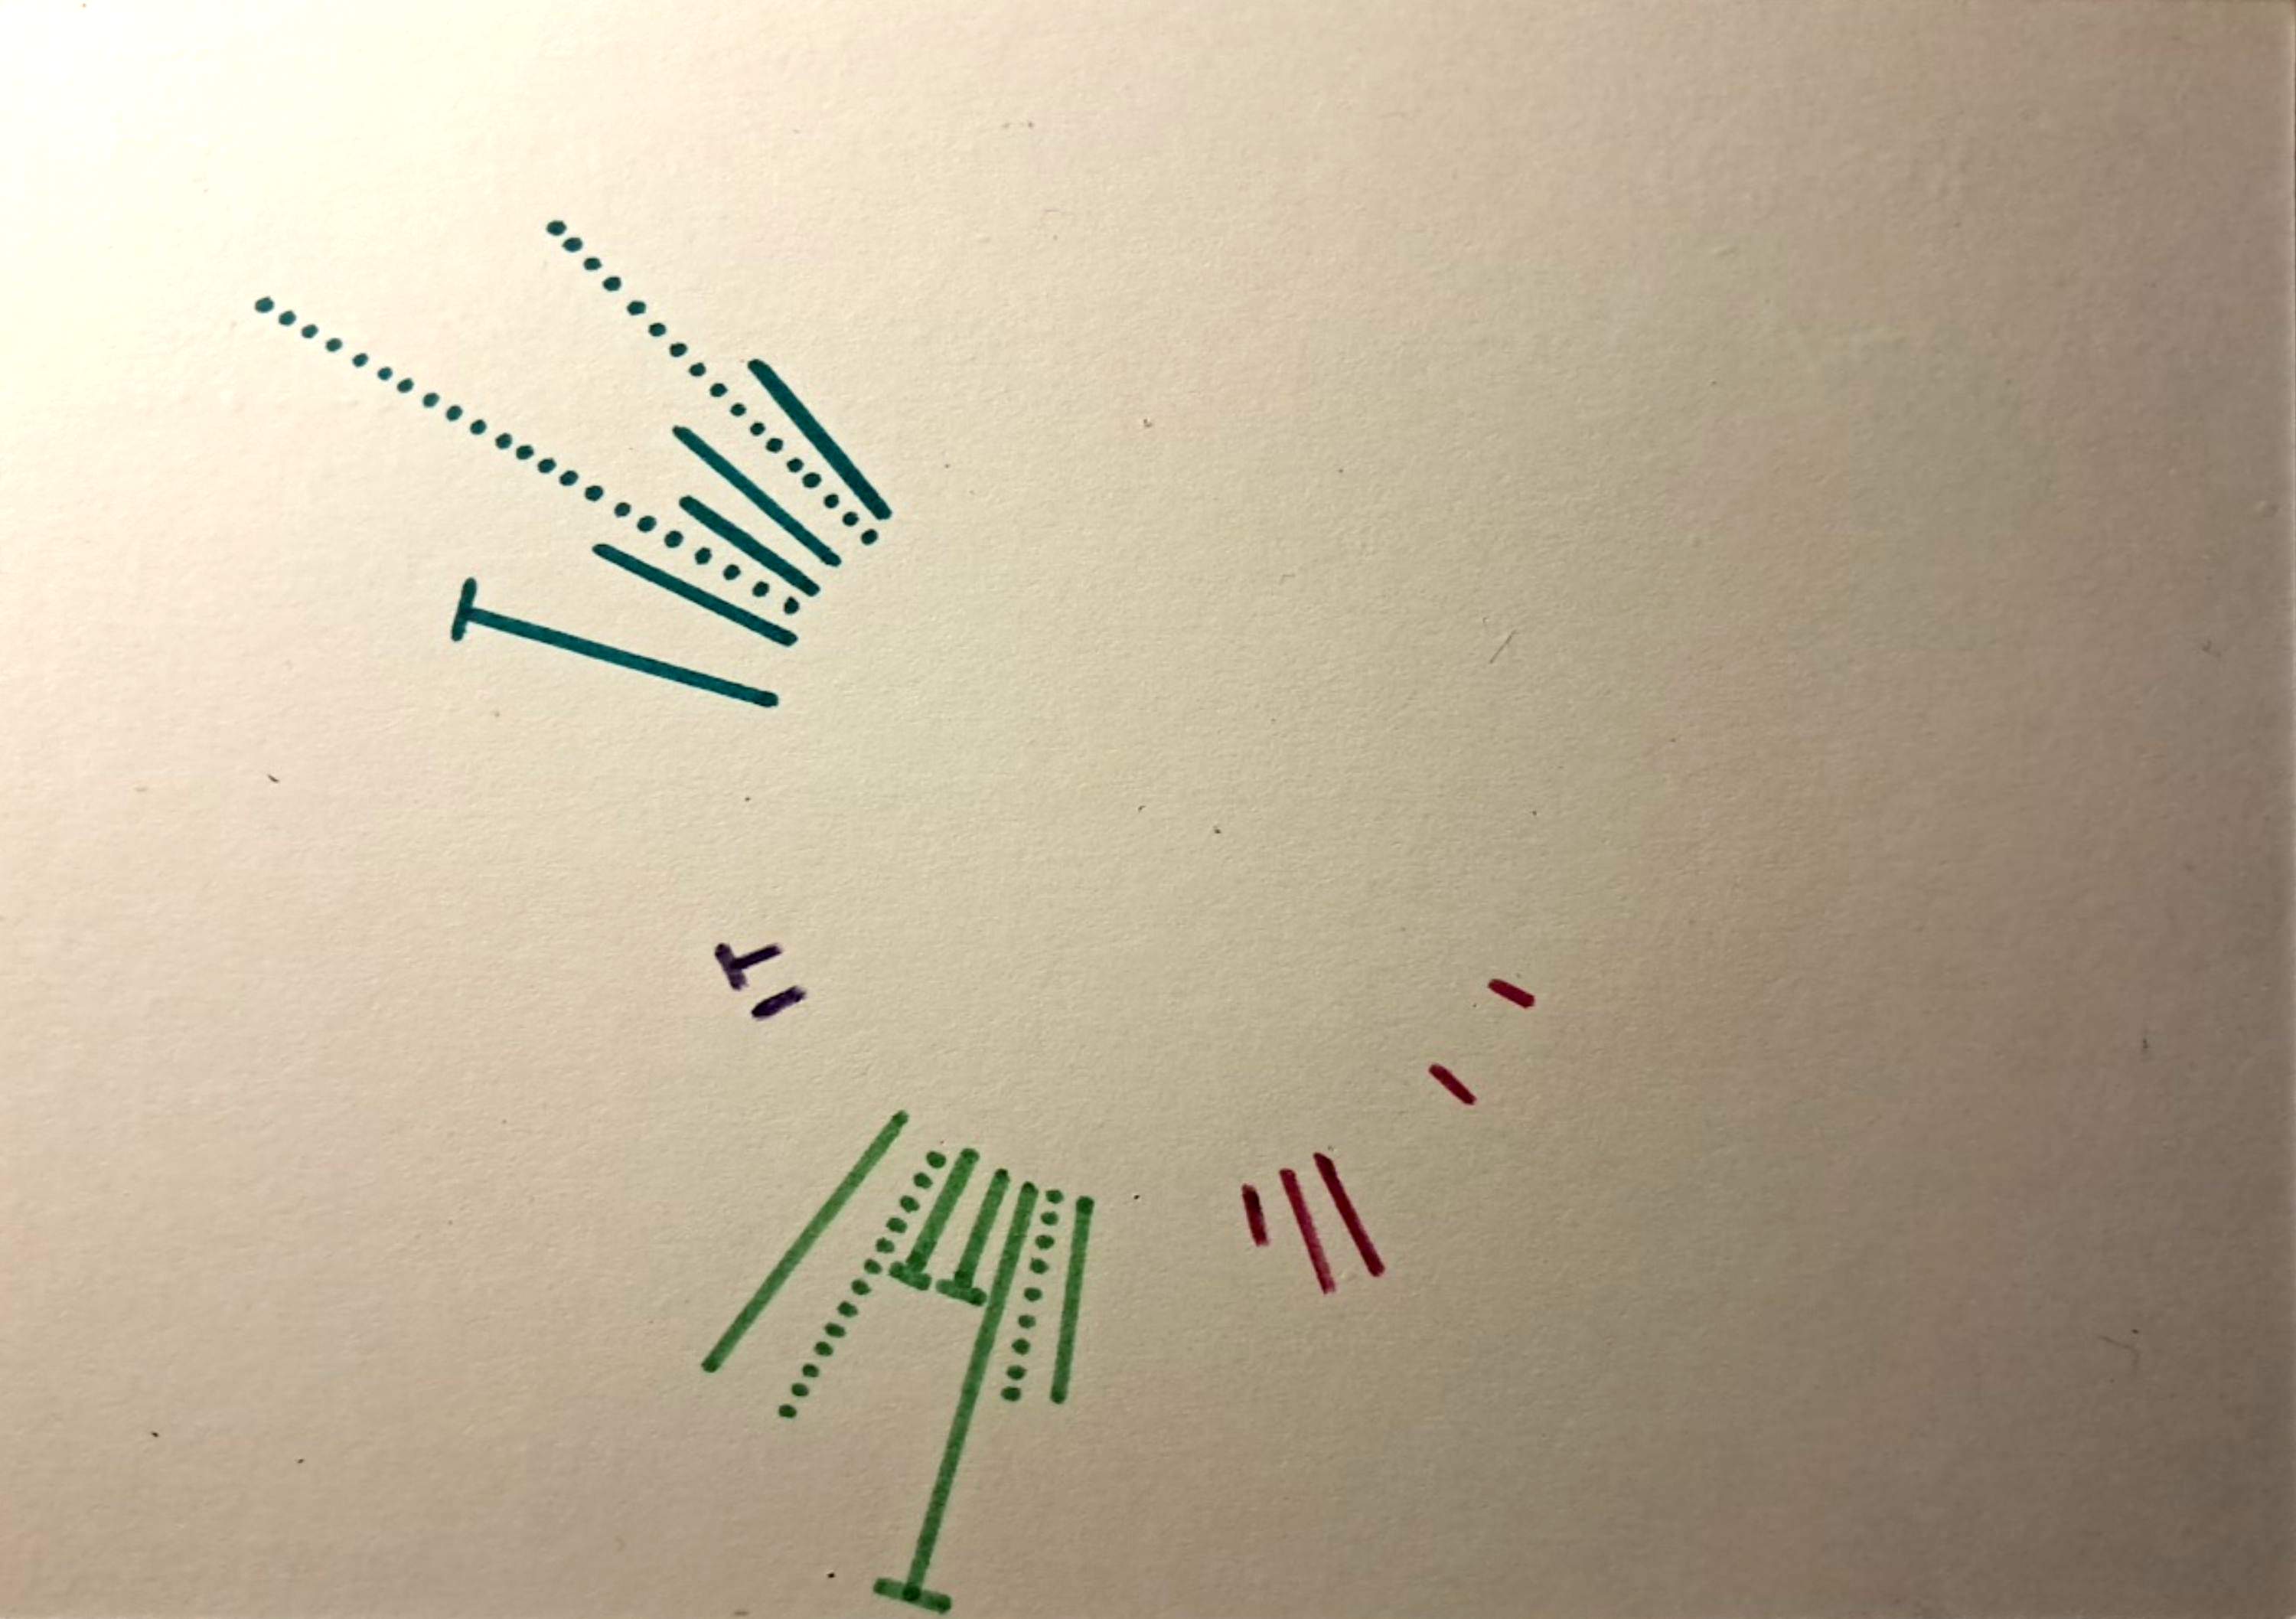
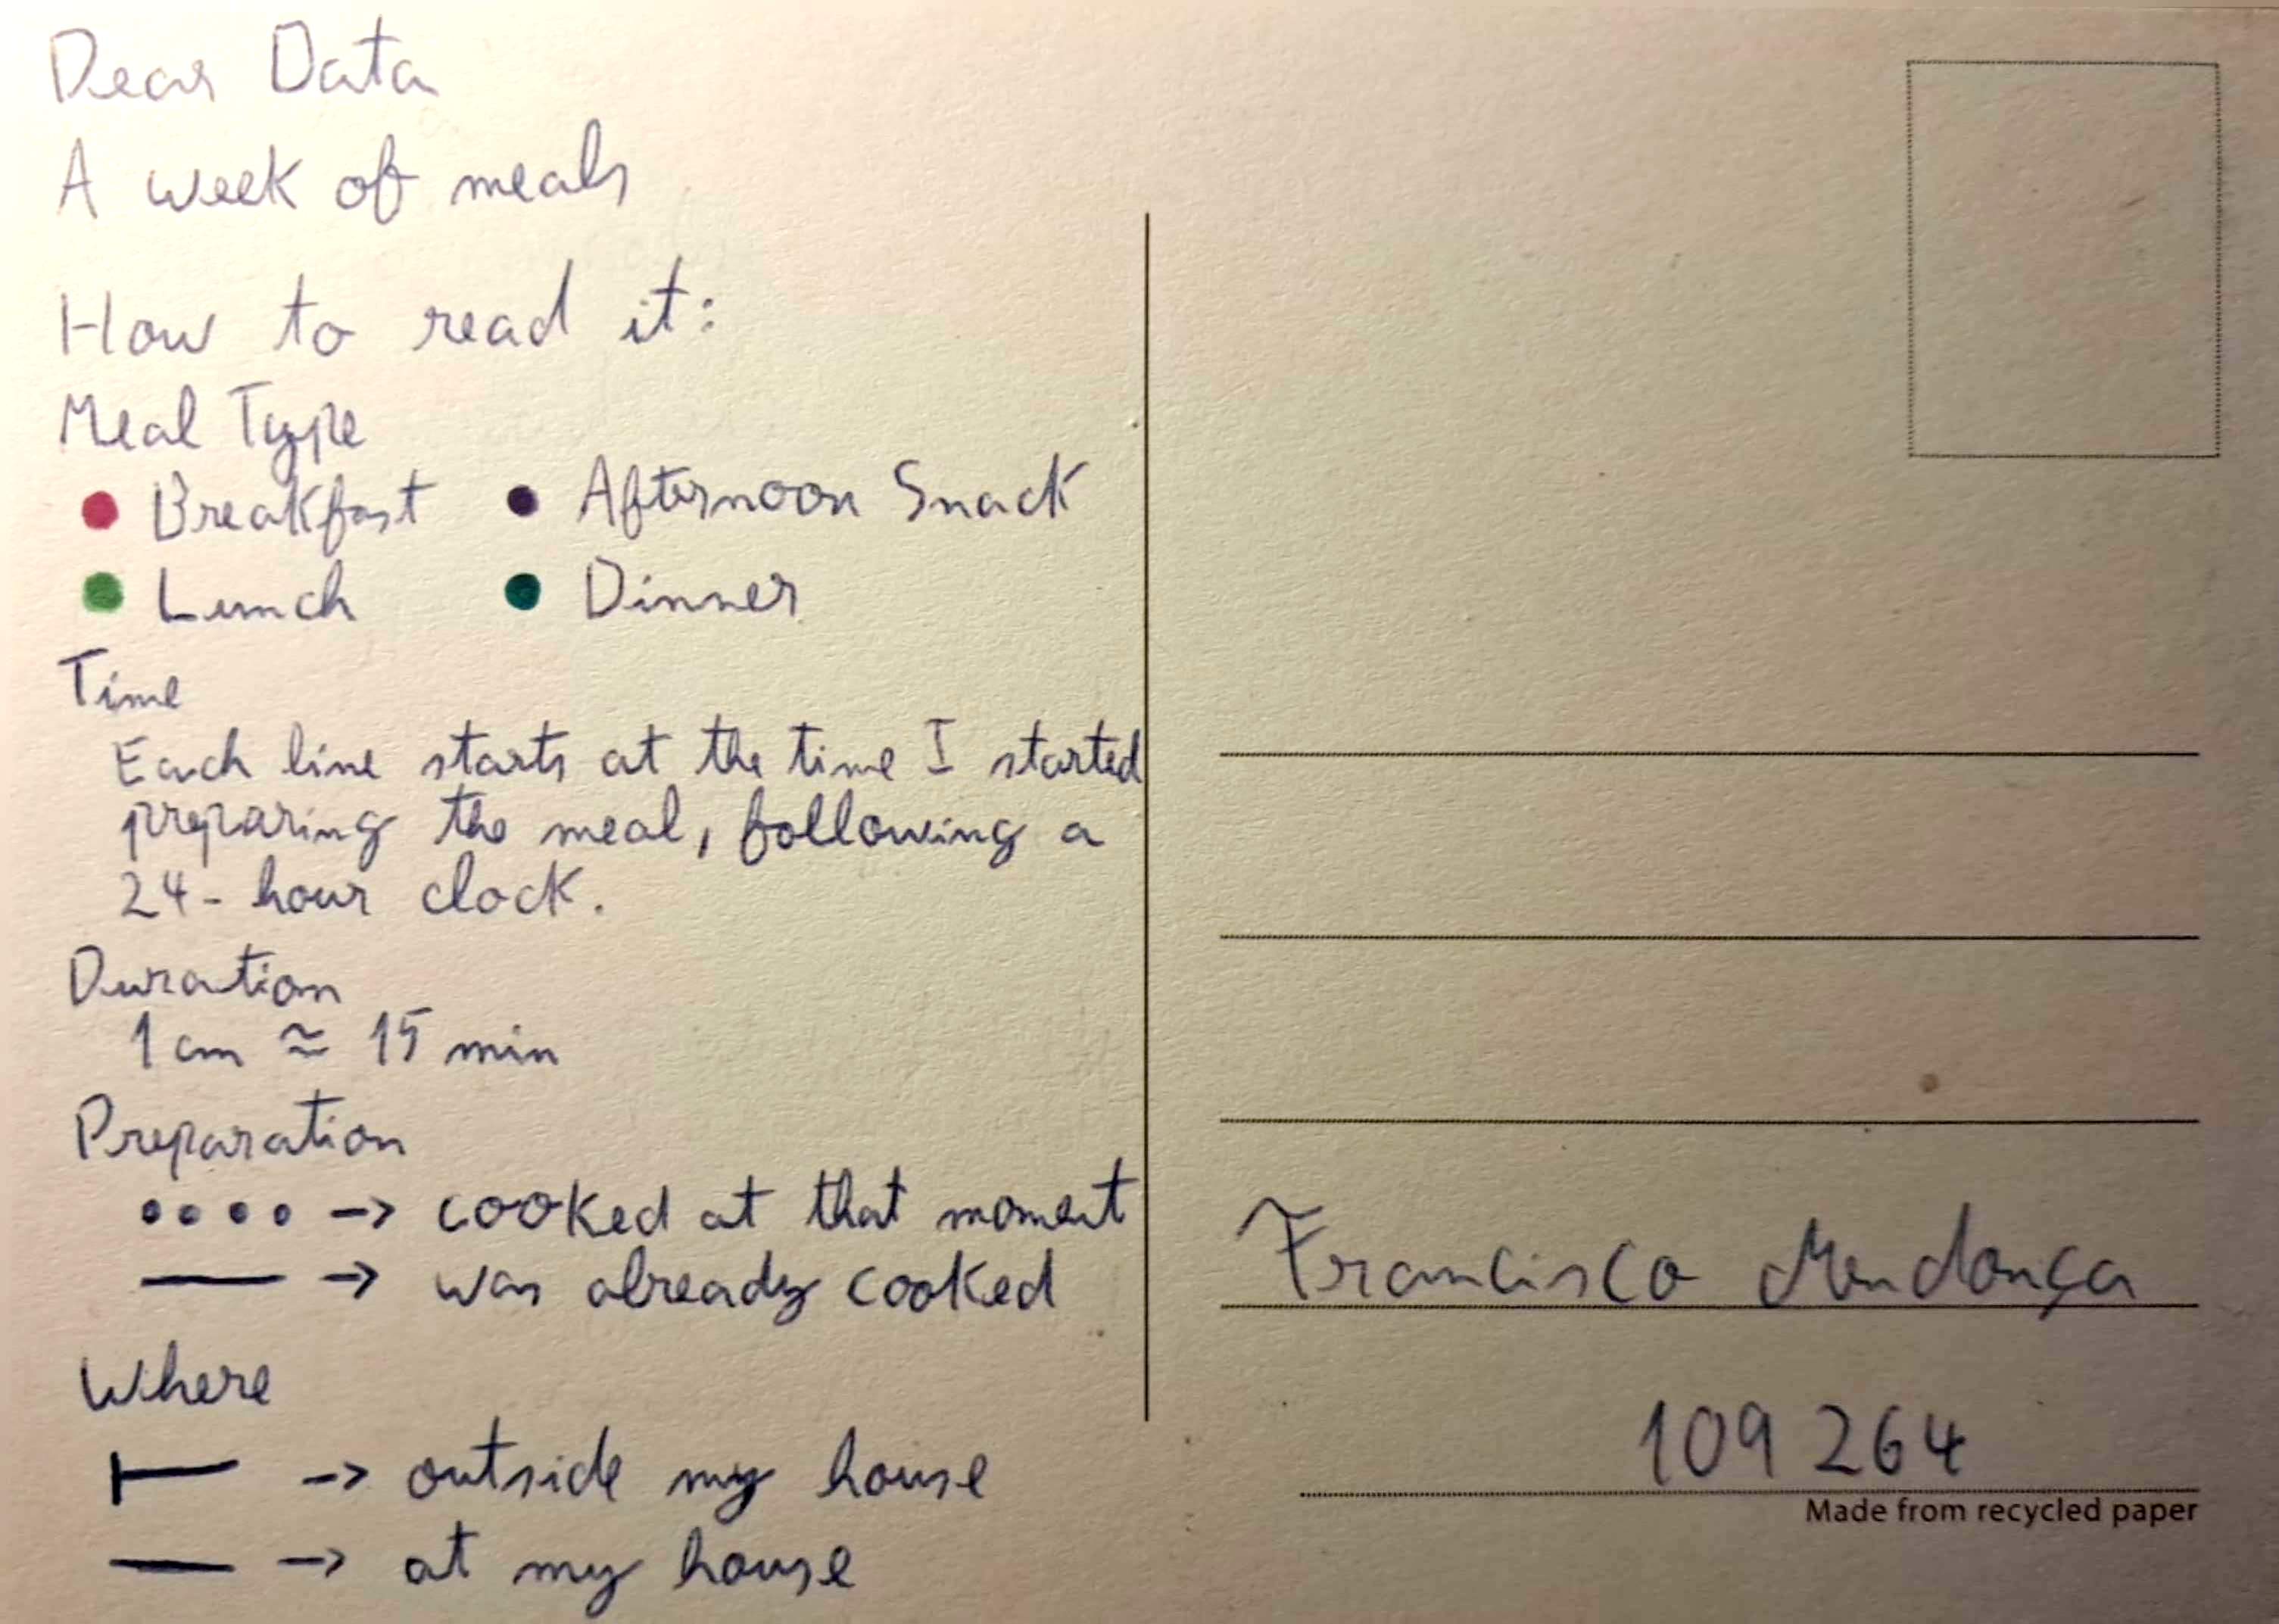
Assignment goal: Collect a personally meaningful kind of data for at least a week, then
find a visual way to tell its story on a postcard.
My approach: I recorded my meals and used colour, line length, and marks to show meal
type, start time, duration, preparation, and where I ate.
FrontBack and key
BEYOND THE SCREEN
Physical Vis
Foldable map · 3D data
Assignment goal: Explore how a physical, three-dimensional object can make data
tangible, using space and materials in ways a flat chart cannot.
My approach: I made a Central Park map that folds into a portable cube. Pins mark
squirrel sightings: red for juveniles, blue for adults, and pin depth for ground level or above.
Watch the physical visualization in use.
SMALL MULTIPLES · WAFFLE CHART
Data Mural
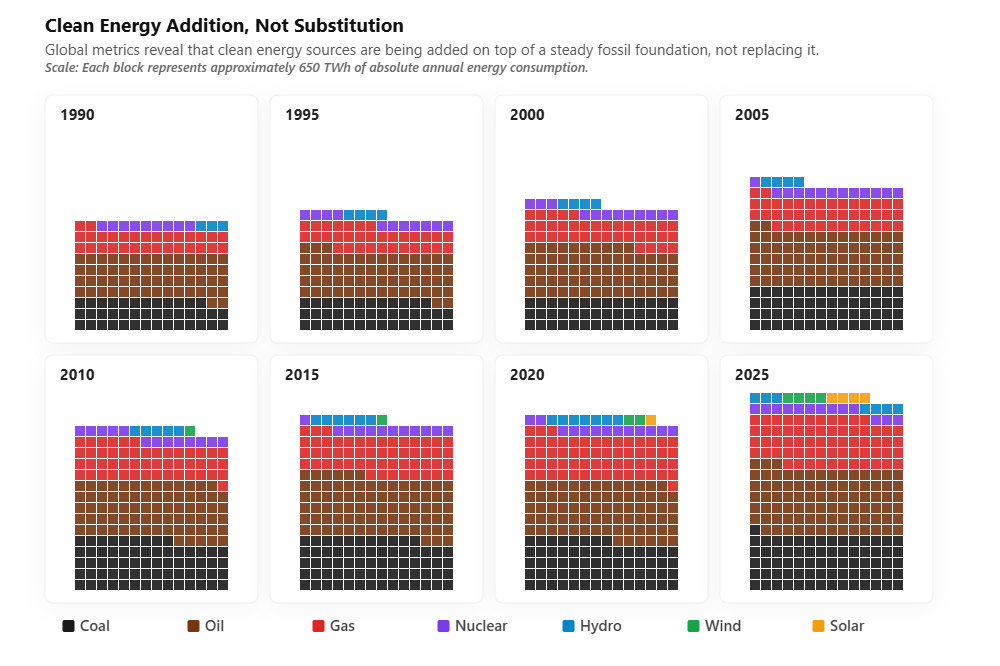
Energy sources over time
Assignment goal: Use the same dataset and question as the class to show how different
visualization choices can reveal different patterns—there is no single “correct” chart.
My approach: I used small-multiple waffle charts to compare energy sources over time.
They show clean and fossil energy both growing, meaning clean energy has not simply replaced fossil fuels.
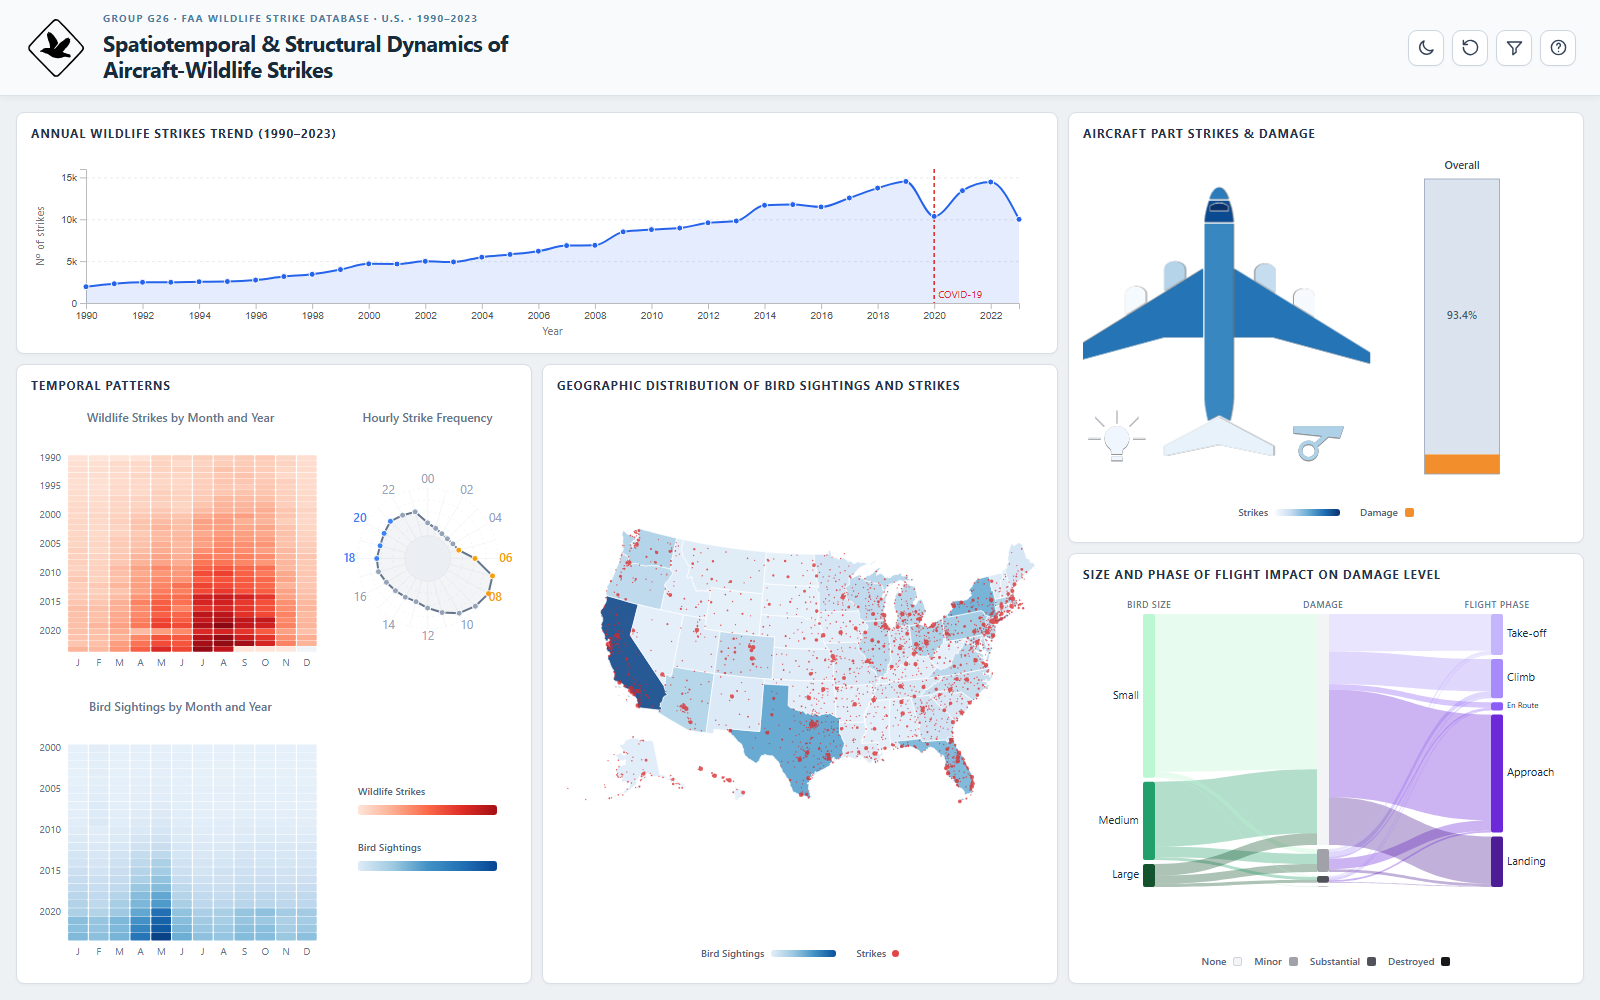
FAA WILDLIFE STRIKE DATABASE · 1990–2023
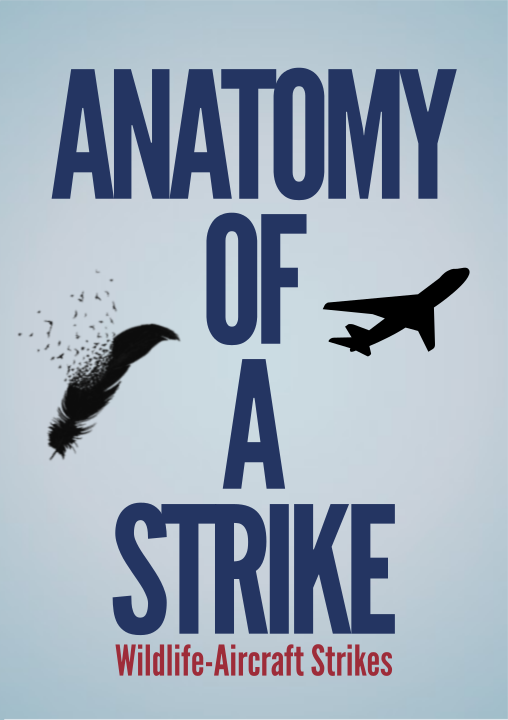
Data Zine: Anatomy of a Strike
An investigative booklet
Assignment goal: Turn data into a small publication where visualizations support a
narrative through page order, pacing, and editorial design.
My approach: I made a case-file-style zine from FAA wildlife-strike reports, treating
each chart as evidence. It highlights the contrast between detailed aircraft records and the lack of
information about birds, despite the fact that only 6.84% of reports document aircraft damage, whereas
birds are affected in every incident.
Cover · 1 / 5
Click the right page to move forward, or the left page to go back. You can also use
the arrows.